2020 年 Dask 用户调查结果
目录
实时 Notebook
您可以在实时会话中运行此 notebook ![]() ,或在 Github 上查看。
,或在 Github 上查看。
2020 年 Dask 用户调查结果
本 notebook 介绍了 2020 年 Dask 用户调查的结果,该调查于今年夏天早些时候进行。感谢所有抽出时间填写调查的人!这些结果有助于我们更好地了解 Dask 社区,并将指导未来的开发工作。
原始数据以及初步分析可以在此 binder 中找到
![]()
如果您在数据中发现任何内容,请告知我们。
重点
我们收到了 240 份调查回复(略少于去年的约 260 份)。总体情况与去年类似。社区最大的变化是对更好性能的更强需求。
[1]:
%matplotlib inline

import pandas as pd
import seaborn as sns
import matplotlib.pyplot as plt
import textwrap
import re


df2019 = (
    pd.read_csv("data/2019-user-survey-results.csv.gz", parse_dates=["Timestamp"])
      .replace({"How often do you use Dask?": "I use Dask all the time, even when I sleep"}, "Every day")
)

df2020 = (
    pd.read_csv("data/2020-user-survey-results.csv.gz")
      .assign(Timestamp=lambda df: pd.to_datetime(df['Timestamp'], format="%Y/%m/%d %H:%M:%S %p %Z").astype('datetime64[ns]'))
      .replace({"How often do you use Dask?": "I use Dask all the time, even when I sleep"}, "Every day")
)
df2020.head()

common = df2019.columns & df2020.columns
added = df2020.columns.difference(df2019.columns)
dropped = df2019.columns.difference(df2020.columns)

df = pd.concat([df2019, df2020])
df['Year'] = df.Timestamp.dt.year
df = df.set_index(['Year', 'Timestamp']).sort_index()
/tmp/ipykernel_10066/4082487205.py:17: FutureWarning: Using .astype to convert from timezone-aware dtype to timezone-naive dtype is deprecated and will raise in a future version.  Use obj.tz_localize(None) or obj.tz_convert('UTC').tz_localize(None) instead
  .assign(Timestamp=lambda df: pd.to_datetime(df['Timestamp'], format="%Y/%m/%d %H:%M:%S %p %Z").astype('datetime64[ns]'))
/tmp/ipykernel_10066/4082487205.py:22: FutureWarning: Index.__and__ operating as a set operation is deprecated, in the future this will be a logical operation matching Series.__and__.  Use index.intersection(other) instead.
  common = df2019.columns & df2020.columns
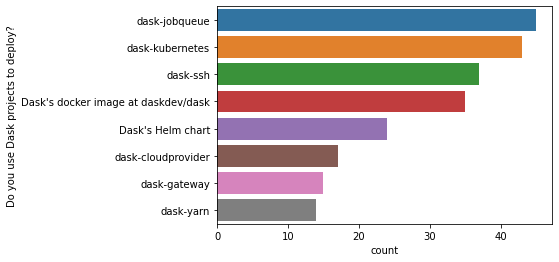
大多数问题与 2019 年相同。我们添加了几个关于部署和仪表盘使用的问题。让我们先看看这些。
在使用 Dask 包部署集群的受访者中(约占受访者的 53%),方法多种多样。
[2]:
k = 'Do you use Dask projects to deploy?'
d = df2020['Do you use Dask projects to deploy?'].dropna().str.split(";").explode()
top = d.value_counts()
top = top[top > 10].index
sns.countplot(y=k, data=d[d.isin(top)].to_frame(), order=top);
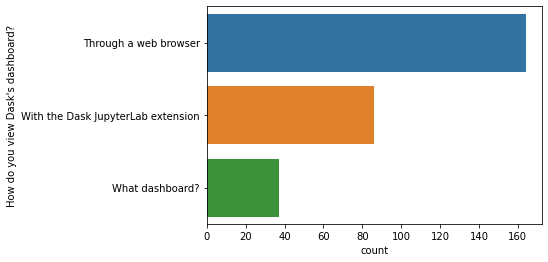
大多数人通过网页浏览器访问仪表盘。那些不使用仪表盘的人可能(希望如此)只是在单机上使用带线程调度器的 Dask(尽管仪表盘在单机上也运行良好)。
[3]:
k = "How do you view Dask's dashboard?"
sns.countplot(y=k, data=df2020[k].dropna().str.split(";").explode().to_frame());
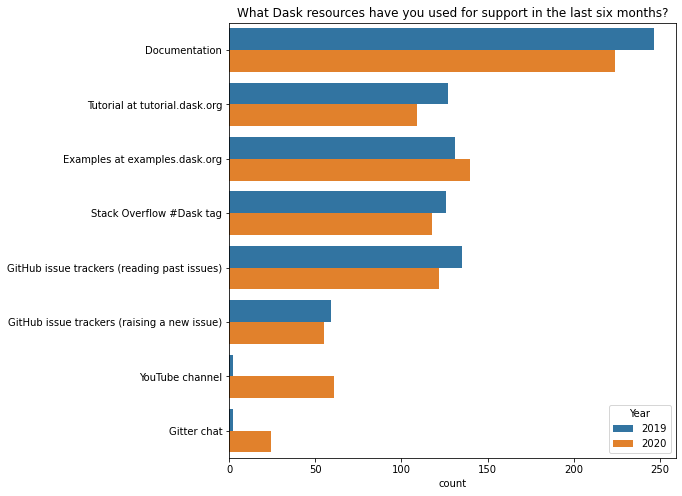
Dask 的学习资料与去年非常相似。最显著的差异来自我们的调查表提供了更多选项(我们的YouTube 频道和“Gitter 聊天”)。除此之外,https://examples.dask.org.cn 可能相对更受欢迎。
[4]:
k = 'What Dask resources have you used for support in the last six months?'

resource_map = {
    "Tutorial": "Tutorial at tutorial.dask.org",
    "YouTube": "YouTube channel",
    "gitter": "Gitter chat"
}

d = df[k].str.split(';').explode().replace(resource_map)
top = d.value_counts()[:8].index
d = d[d.isin(top)]

fig, ax = plt.subplots(figsize=(8, 8))
ax = sns.countplot(y=k, hue="Year", data=d.reset_index(), ax=ax);
ax.set(ylabel="", title=k);
您如何使用 Dask?
就像去年一样,我们将根据使用 Dask 的频率来查看资源使用情况。
[5]:
resource_palette = (
    df['What Dask resources have you used for support in the last six months?'].str.split(";").explode().replace(resource_map).replace(re.compile("GitHub.*"), "GitHub").value_counts()[:6].index
)
resource_palette = dict(zip(resource_palette, sns.color_palette("Paired")))

usage_order = ['Every day', 'Occasionally', 'Just looking for now']

def resource_plot(df, year, ax):
    resources = (
        df.loc[year, 'What Dask resources have you used for support in the last six months?']
          .str.split(";")
          .explode()
          .replace(resource_map)
    )
    top = resources.value_counts().head(6).index
    resources = resources[resources.isin(top)]

    m = (
        pd.merge(df.loc[year, ['How often do you use Dask?']], resources, left_index=True, right_index=True)
          .replace(re.compile("GitHub.*"), "GitHub")
    )

    ax = sns.countplot(hue="What Dask resources have you used for support in the last six months?",
                  y='How often do you use Dask?',
                  order=usage_order,
                  data=m, ax=ax,
                  hue_order=list(resource_palette),
                  palette=resource_palette)
    sns.despine()
    return ax

fig, axes = plt.subplots(figsize=(20, 10), ncols=2)
ax1 = resource_plot(df, 2019, axes[0])
ax2 = resource_plot(df, 2020, axes[1])
ax1.set_title("2019")
ax2.set_title("2020");
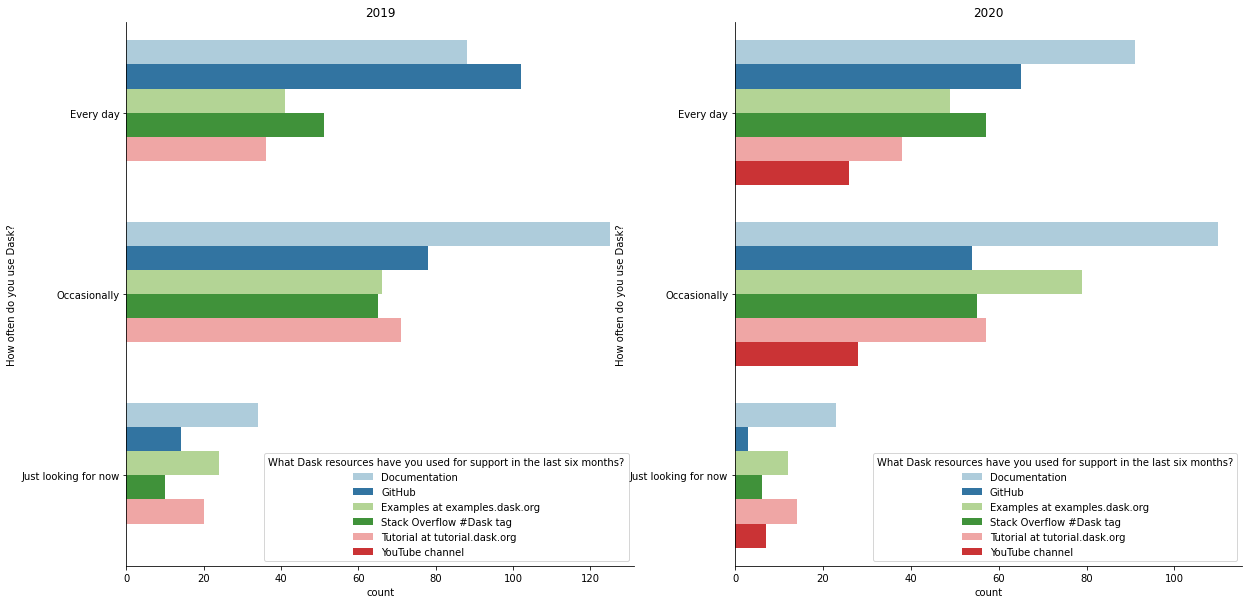
一些观察
GitHub issues 在中度和重度 Dask 用户中相对不那么受欢迎,这可能反映了文档或稳定性有所改进(假设人们在文档中找不到答案或遇到 bug 时才会去 issue 跟踪器)。
https://examples.dask.org.cn 现在在偶尔使用 Dask 的用户中尤其受欢迎。
针对去年的调查,我们投入时间改进了 https://tutorial.dask.org.cn,此前我们认为它有所欠缺。其使用量仍然与去年大致相同(相当受欢迎),因此不清楚我们是否应该在那方面投入更多精力。
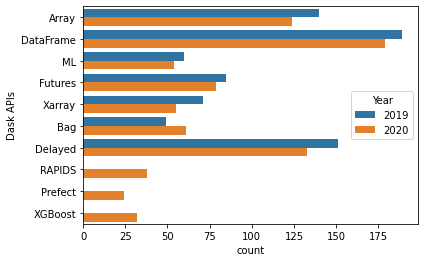
API 使用情况与去年大致相同(请注意,今年的调查人数少了约 20 人,并且人们可以选择多个选项,因此相对差异最值得关注)。我们为 RAPIDS、Prefect 和 XGBoost 添加了新的选项,它们都比较受欢迎(与 dask.Bag 的受欢迎程度相近)。
[6]:
apis = df['Dask APIs'].str.split(";").explode()
top = apis.value_counts().loc[lambda x: x > 10]
apis = apis[apis.isin(top.index)].reset_index()

sns.countplot(y="Dask APIs", hue="Year", data=apis);
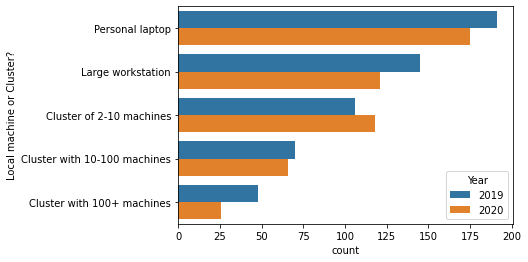
就像去年一样,大约 65% 的用户至少会在某些时候在集群上使用 Dask。
[7]:
df['Local machine or Cluster?'].dropna().str.contains("Cluster").astype(int).groupby("Year").mean()
[7]:
Year
2019    0.654902
2020    0.666667
Name: Local machine or Cluster?, dtype: float64
但大多数受访者也在他们的笔记本电脑上使用 Dask。这凸显了 Dask 向下扩展的重要性,无论是使用 LocalCluster 进行原型设计,还是使用 LocalCluster 或任一单机调度器进行内存外分析。
[8]:
order = [
    'Personal laptop',
    'Large workstation',
    'Cluster of 2-10 machines',
    'Cluster with 10-100 machines',
    'Cluster with 100+ machines'
]
d = df['Local machine or Cluster?'].str.split(";").explode().reset_index()
sns.countplot(y="Local machine or Cluster?", data=d, hue="Year", order=order);
就像去年一样,大多数受访者认为增加文档和示例是对项目最有价值的改进。
一个有趣的变化来自查看“目前对您最有帮助的是什么?”,并按 API 组(dask.dataframe、dask.array 等)进行划分。去年显示,“我所在领域的更多示例”对所有 API 组都是最重要的(下面的第一个表格)。但在 2020 年,有一些差异(下面的第二个图)。
[9]:
help_by_api = (
    pd.merge(
        df.loc[2019, 'Dask APIs'].str.split(';').explode(),
        df.loc[2019, 'Which would help you most right now?'],
        left_index=True, right_index=True)
    .groupby('Which would help you most right now?')['Dask APIs'].value_counts()
    .unstack(fill_value=0).T
    .loc[['Array', 'Bag', 'DataFrame', 'Delayed', 'Futures', 'ML', 'Xarray']]

)
(
    help_by_api
        .style
        .background_gradient(axis="columns")
        .set_caption("2019 normalized by row. Darker means that a higher proporiton of "
                     "users of that API prefer that priority.")
)
[9]:
| 目前对您最有帮助的是什么? | 错误修复 | 更多文档 | 我所在领域的更多示例 | 新功能 | 性能改进 |
|---|---|---|---|---|---|
| Dask API | |||||
| 数组 | 10 | 24 | 62 | 15 | 25 |
| Bag | 3 | 11 | 16 | 10 | 7 |
| DataFrame | 16 | 32 | 71 | 39 | 26 |
| Delayed | 16 | 22 | 55 | 26 | 27 |
| Futures | 12 | 9 | 25 | 20 | 17 |
| ML | 5 | 11 | 23 | 11 | 7 |
| Xarray | 8 | 11 | 34 | 7 | 9 |
[10]:
help_by_api = (
    pd.merge(
        df.loc[2020, 'Dask APIs'].str.split(';').explode(),
        df.loc[2020, 'Which would help you most right now?'],
        left_index=True, right_index=True)
    .groupby('Which would help you most right now?')['Dask APIs'].value_counts()
    .unstack(fill_value=0).T
    .loc[['Array', 'Bag', 'DataFrame', 'Delayed', 'Futures', 'ML', 'Xarray']]

)
(
    help_by_api
        .style
        .background_gradient(axis="columns")
        .set_caption("2020 normalized by row. Darker means that a higher proporiton of "
                     "users of that API prefer that priority.")
)
[10]:
| 目前对您最有帮助的是什么? | 错误修复 | 更多文档 | 我所在领域的更多示例 | 新功能 | 性能改进 |
|---|---|---|---|---|---|
| Dask API | |||||
| 数组 | 12 | 16 | 56 | 15 | 23 |
| Bag | 7 | 5 | 24 | 7 | 16 |
| DataFrame | 24 | 21 | 67 | 22 | 41 |
| Delayed | 15 | 19 | 46 | 17 | 34 |
| Futures | 9 | 10 | 21 | 13 | 24 |
| ML | 6 | 4 | 21 | 9 | 12 |
| Xarray | 3 | 4 | 25 | 9 | 13 |
示例再次是最重要的(除了 Futures 之外的所有 API 组)。但“性能改进”现在是第二重要的领域(除了 Futures,它在那里是最重要的)。我们应该如何解释这一点?一个好的解释是,Dask 用户正在将问题扩展到更大规模,并遇到了新的扩展挑战。一个不太好的解释是,我们用户的工作流保持不变,但 Dask 变慢了!
常见功能请求
对于特定功能,我们列出了我们(作为开发者)认为可能重要的一些事项。
[11]:
common = (df[df.columns[df.columns.str.startswith("What common feature")]]
          .rename(columns=lambda x: x.lstrip("What common feature requests do you care about most?[").rstrip(r"]")))
a = common.loc[2019].apply(pd.value_counts).T.stack().reset_index().rename(columns={'level_0': 'Question', 'level_1': "Importance", 0: "count"}).assign(Year=2019)
b = common.loc[2020].apply(pd.value_counts).T.stack().reset_index().rename(columns={'level_0': 'Question', 'level_1': "Importance", 0: "count"}).assign(Year=2020)

counts = pd.concat([a, b], ignore_index=True)

d = common.stack().reset_index().rename(columns={"level_2": "Feature", 0: "Importance"})
order = ["Not relevant for me", "Somewhat useful", 'Critical to me']
sns.catplot('Importance', row="Feature", kind="count", col="Year", data=d, sharex=False, order=order);
/usr/share/miniconda3/envs/dask-examples/lib/python3.9/site-packages/seaborn/_decorators.py:36: FutureWarning: Pass the following variable as a keyword arg: x. From version 0.12, the only valid positional argument will be `data`, and passing other arguments without an explicit keyword will result in an error or misinterpretation.
  warnings.warn(
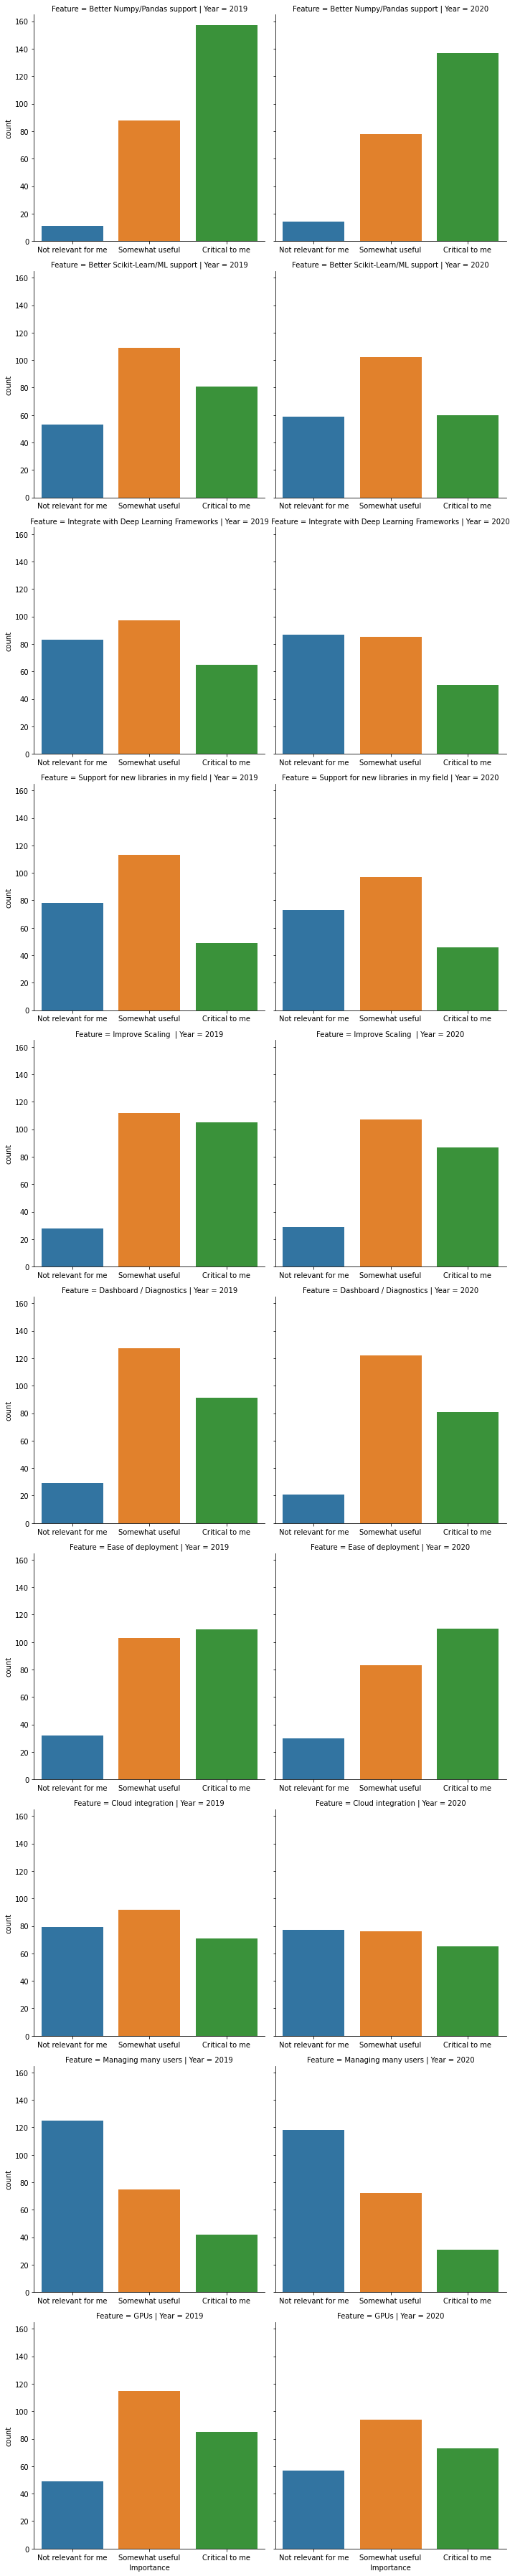
与去年相比,各项功能的相对重要性并没有真正的变化。可能最大的变化是“易于部署”,其中“对我来说至关重要”现在相对更受欢迎(尽管去年它已经是最受欢迎的了)。
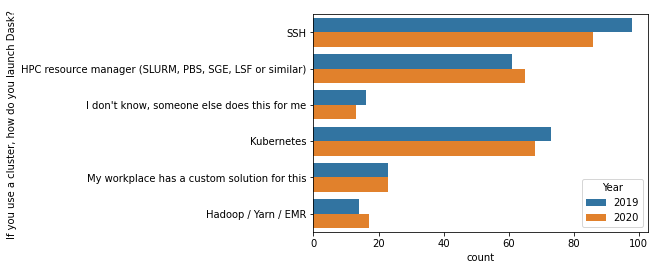
您还使用哪些其他系统?
SSH 仍然是最受欢迎的“集群资源管理器”。这是去年的一个大惊喜,所以我们投入了一些工作来使其更好用。除此之外,变化不大。
[12]:
c = df['If you use a cluster, how do you launch Dask? '].dropna().str.split(";").explode()
top = c.value_counts().index[:6]
sns.countplot(y="If you use a cluster, how do you launch Dask? ", data=c[c.isin(top)].reset_index(), hue="Year");
Dask 用户对其稳定性的满意度与去年大致相同。
[13]:
# fig, ax = plt.subplots(figsize=(9, 6))
sns.countplot(y="Is Dask stable enough for you?", hue="Year", data=df.reset_index())
sns.despine()

要点
总的来说,大多数情况与去年类似。
文档,特别是领域特定的示例,仍然很重要。
更多用户正在将 Dask 推向更深远的领域。投资于性能可能会非常有价值。
再次感谢所有受访者。我们期待重复这一过程,以识别随时间变化的趋势。