2021 Dask 用户调查结果
目录
实时 Notebook
您可以在实时会话中运行此 notebook ![]() ,或在 Github 上查看。
,或在 Github 上查看。
2021 Dask 用户调查结果
本文介绍了今年早些时候进行的 2021 年 Dask 用户调查结果。感谢所有抽出时间填写调查问卷的人!这些结果有助于我们更好地了解 Dask 社区,并将指导未来的开发工作。
原始数据以及分析的开始可以在此 binder 中找到
![]()
如果您在数据中发现任何问题,请告知我们。
要点
我们收到了 247 份调查回复(与去年的 240 份回复基本相同)。总体而言,回复与往年类似。
我们在调查中提出了 43 个问题(比上一年增加了 18 个问题)。我们问了很多关于人们处理的数据集类型、Dask 的稳定性以及人们工作的行业类型的新问题。
我们的社区希望
更多的文档和示例
更多的中级文档
提高 Dask 的弹性(即计算是否能完成?)
用户也看重这些特性
改进的扩展性
易于部署
更好的 scikit-learn 和机器学习支持
典型的 Dask 用户
调查显示,我们的社区具有很大的多样性,并且没有使用 Dask 的唯一方法。也就是说,我们假设的“典型”Dask 用户
处理千兆字节大小的数据集
存储在本地文件系统上
使用 Dask 介于 1 到 3 年之间
偶尔使用 Dask,而不是每天
至少部分时间以交互方式使用 Dask
使用计算集群(可能)
喜欢使用网络浏览器查看 Dask 仪表板
在大多数情况下,Dask 对他们的需求来说足够稳定,但提高 Dask 的弹性会有所帮助
使用 Dask dataframe、delayed 以及可能的 Dask Array API,以及 numpy/pandas 和其他 python 库
对这个人帮助最大的事情是更多的文档,以及在他们领域中使用 Dask 的更多示例。
他们可能在科学领域工作(例如地球科学、生命科学、物理学或天文学),或者他们可能在会计、金融、保险领域工作,或者是一名技术工人。
您可以在此处阅读往年的调查结果:2020 年调查结果,2019 年调查结果。
[1]:
# Let's load in the survey data...
%matplotlib inline

from pprint import pprint
import pandas as pd
import seaborn as sns
import matplotlib.pyplot as plt
import textwrap
import re


df2019 = (
    pd.read_csv("data/2019-user-survey-results.csv.gz", parse_dates=["Timestamp"])
      .replace({"How often do you use Dask?": "I use Dask all the time, even when I sleep"}, "Every day")
)

df2020 = (
    pd.read_csv("data/2020-user-survey-results.csv.gz")
      .assign(Timestamp=lambda df: pd.to_datetime(df['Timestamp'], format="%Y/%m/%d %H:%M:%S %p %Z").astype('datetime64[ns]'))
      .replace({"How often do you use Dask?": "I use Dask all the time, even when I sleep"}, "Every day")
)

df2021 = (
    pd.read_csv("data/2021-user-survey-results.csv.gz")
      .assign(Timestamp=lambda df: pd.to_datetime(df['Timestamp']).astype('datetime64[ns]'))
      .replace({"How often do you use Dask?": "I use Dask all the time, even when I sleep"}, "Every day")
)

common = df2019.columns.intersection(df2020.columns).intersection(df2021.columns)
added = df2021.columns.difference(df2020.columns)
dropped = df2020.columns.difference(df2021.columns)

df = pd.concat([df2019, df2020, df2021])
df['Year'] = df.Timestamp.dt.year
df = df.set_index(['Year', 'Timestamp']).sort_index()
/tmp/ipykernel_10088/2760444752.py:19: FutureWarning: Using .astype to convert from timezone-aware dtype to timezone-naive dtype is deprecated and will raise in a future version.  Use obj.tz_localize(None) or obj.tz_convert('UTC').tz_localize(None) instead
  .assign(Timestamp=lambda df: pd.to_datetime(df['Timestamp'], format="%Y/%m/%d %H:%M:%S %p %Z").astype('datetime64[ns]'))
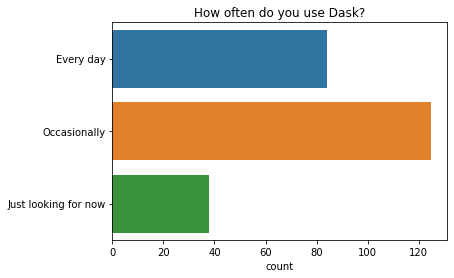
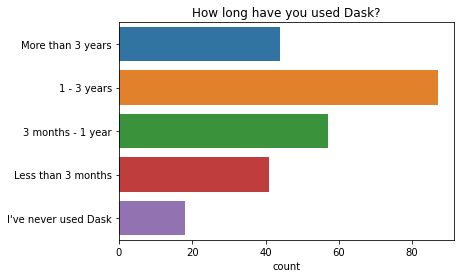
谁是 Dask 用户?
大多数人表示他们偶尔使用 Dask,而一小部分人每天都使用 Dask。人们使用 Dask 的时间长短差异很大,最常见的回答是介于一到三年之间。
[2]:
q = "How often do you use Dask?"
ax = sns.countplot(y=q, data=df2021[q].dropna().str.split(";").explode().to_frame());
ax.set(ylabel="", title=q);
[3]:
q = "How long have you used Dask?"  # New question in 2021
order = ["More than 3 years", "1 - 3 years", "3 months - 1 year", "Less than 3 months", "I've never used Dask"]
ax = sns.countplot(y=q, data=df2021[q].dropna().str.split(";").explode().to_frame(), order=order);
ax.set(ylabel="", title=q);
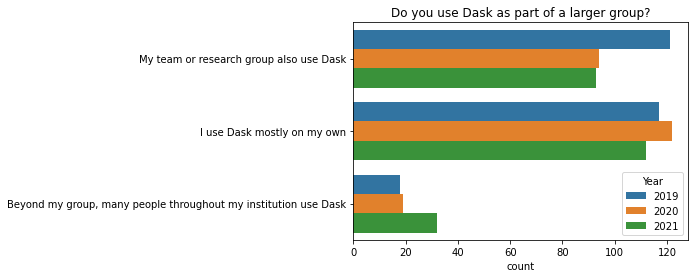
略多于一半的受访者与其他人(他们的团队或组织)一起使用 Dask,另一半则独自使用 Dask。
[4]:
q = "Do you use Dask as part of a larger group?"
order = [
    'I use Dask mostly on my own',
    'My team or research group also use Dask',
    'Beyond my group, many people throughout my institution use Dask',
]
ax = sns.countplot(y=q, data=df2021[q].dropna().str.split(";").explode().to_frame(), order=order)
ax.set(ylabel="", title=q);
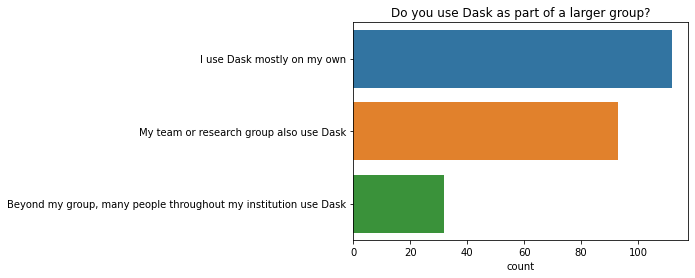
在过去一年中,表示其所在机构有许多人使用 Dask 的人数有所增加(2021 年有 32 人,2020 年为 19 人)。在 2019 年至 2020 年期间,表示其直属团队也使用 Dask 的人数有所下降(2019 年有 121 人,2020 年为 94 人)。目前尚不清楚我们为何看到这些变化,因此观察未来几年的情况会很有趣。
[5]:
q = 'Do you use Dask as part of a larger group?'
ax = sns.countplot(y=q, hue="Year", data=df.reset_index());
ax.set(ylabel="", title=q);
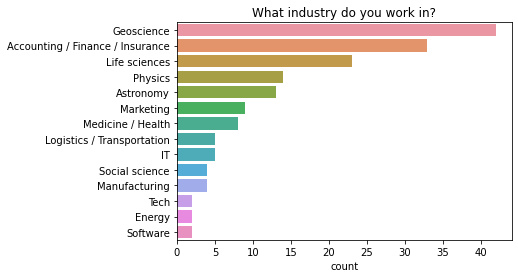
您从事哪个行业?
调查中涉及了广泛的行业。
几乎一半的回复来自与科学、学术界或政府实验室相关的行业。地球科学的回复最多,而生命科学、物理学和天文学也是热门领域。
约有 30% 的回复来自商业和科技领域的人员。其中,会计/金融/保险领域的人员与其他技术工作者的比例大致持平。
约有 10% 的回复来自制造业、工程和其他行业(能源、航空航天等)。其余回复难以分类。
[6]:
q = "What industry do you work in?"  # New question in 2021
data = df2021[q].dropna().str.split(";").explode().to_frame()
order = data.value_counts()[data.value_counts() > 1].keys().get_level_values(0)
ax = sns.countplot(y=q, data=data, order=order);
ax.set(ylabel="", title=q);
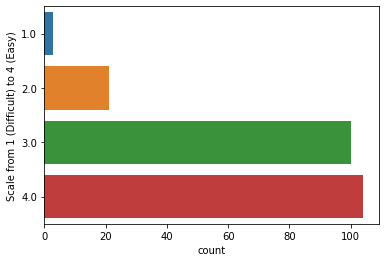
升级到新版本的 Python 库对您来说有多容易?
大多数用户在需要时能够轻松升级到新版本的 Python 库。
[7]:
q = "How easy is it for you to upgrade to newer versions of Python libraries"
sns.countplot(y=q, data=df2021[q].dropna().explode().to_frame()).set_ylabel('Scale from 1 (Difficult) to 4 (Easy)');
人们如何喜欢使用 Dask
人们喜欢将 Dask 与 numpy 和 pandas 以及其他各种 python 库结合使用。最受欢迎的 Dask API 是 Dask Dataframes、Dask Delayed 和 Dask Arrays。
绝大多数人至少部分时间喜欢与 Jupyter 或 IPython 进行交互式使用 Dask,并且大多数人使用网络浏览器查看 Dask 仪表板。
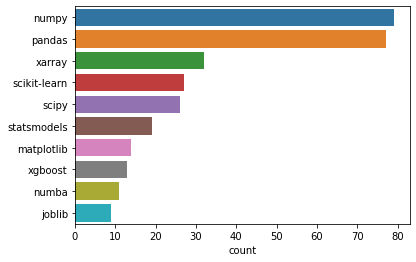
您经常与 Dask 一起使用的其他库有哪些?
人们与 Dask 一起使用的十大常用库是:numpy、pandas、xarray、scikit-learn、scipy、statsmodels、matplotlib、xgboost、numba 和 joblib。
[8]:
q = "What are some other libraries that you often use with Dask?"
data = df2021[q].dropna().str.lower().str.split(", ").explode().to_frame()
labels = pd.value_counts(data[q]).iloc[:10].index
sns.countplot(y=q, data=data, order=labels).set_ylabel('');
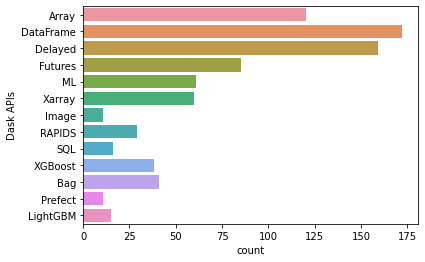
Dask API
人们使用的三个最受欢迎的 Dask API 是:1. Dask Dataframes 2. Dask Delayed 3. Dask Arrays
与往年相比,2021 年使用 dask delayed 的人数略有增加。这可能是一件好事,随着人们对 Dask 经验和信心的增加,他们更有可能开始使用 delayed 等更高级的功能。除了这一变化之外,偏好与往年的结果非常相似。
[9]:
apis = df2021['Dask APIs'].str.split(", ").explode()
top = apis.value_counts().loc[lambda x: x > 10]
apis = apis[apis.isin(top.index)].reset_index()

sns.countplot(y="Dask APIs", data=apis);
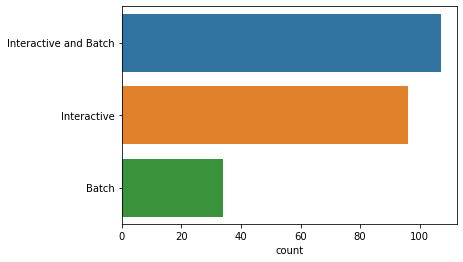
交互式还是批处理?
绝大多数人至少部分时间喜欢与 Jupyter 或 IPython 进行交互式使用 Dask。只有不到 15% 的 Dask 用户仅在批处理模式下使用 Dask(提交未来运行的脚本)。
[10]:
q = 'Interactive or Batch?'
data = df2021[q].dropna()
data = data.str.replace('Interactive:  I use Dask with Jupyter or IPython when playing with data, Batch: I submit scripts that run in the future', "Interactive and Batch")
data = data.str.replace('Interactive:  I use Dask with Jupyter or IPython when playing with data', "Interactive")
data = data.str.replace('Batch: I submit scripts that run in the future', "Batch")
order = ["Interactive and Batch", "Interactive", "Batch"]
sns.countplot(y=q, data=data.explode().to_frame(), order=order).set_ylabel('');
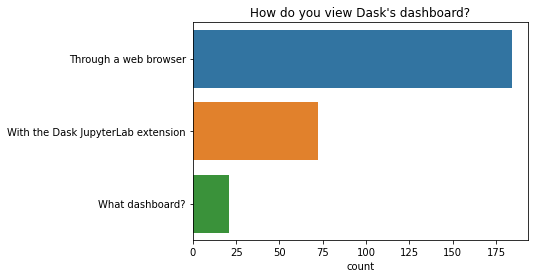
您如何查看 Dask 的仪表板?
大多数人使用网络浏览器查看 Dask 仪表板。一小部分人使用 dask jupyterlab 扩展。
有些人仍然不确定仪表板的全部作用。如果您也是如此,您可能想观看 这个解释仪表板为何超级有用的 20 分钟视频,或在此处查看其余文档。
[11]:
q = "How do you view Dask's dashboard?"
ax = sns.countplot(y=q, data=df2021[q].dropna().str.split(", ").explode().to_frame());
ax.set(ylabel="", title=q);
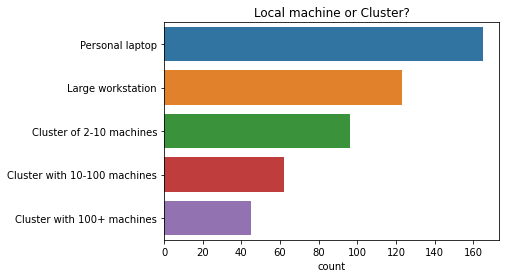
本地机器还是集群?
大约三分之二的受访者至少部分时间使用计算集群。
[12]:
q = 'Local machine or Cluster?'
df[q].dropna().str.contains("Cluster").astype(int).groupby("Year").mean()
[12]:
Year
2019    0.654902
2020    0.666667
2021    0.630081
Name: Local machine or Cluster?, dtype: float64
[13]:
q = 'Local machine or Cluster?'
order = [
    'Personal laptop',
    'Large workstation',
    'Cluster of 2-10 machines',
    'Cluster with 10-100 machines',
    'Cluster with 100+ machines'
]
ax = sns.countplot(y=q, data=df2021[q].dropna().str.split(", ").explode().to_frame(), order=order);
ax.set(ylabel="", title=q);
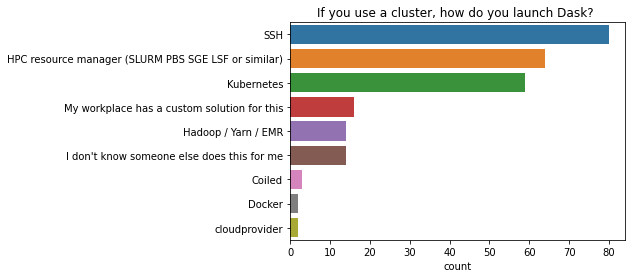
如果您使用集群,如何启动 Dask?
SSH 是在计算集群上启动 Dask 的最常用方法,其次是 HPC 资源管理器,然后是 Kubernetes。
[14]:
q = "If you use a cluster, how do you launch Dask? "
data = df2021[q].dropna()
data = data.str.replace("HPC resource manager (SLURM, PBS, SGE, LSF or similar)", "HPC resource manager (SLURM PBS SGE LSF or similar)", regex=False)
data = data.str.replace("I don't know, someone else does this for me", "I don't know someone else does this for me", regex=False)
data = data.str.split(", ").explode().to_frame()
order = data.value_counts()[data.value_counts() > 1].keys().get_level_values(0)
ax = sns.countplot(y=q, data=data, order=order);
ax.set(ylabel="", title=q);
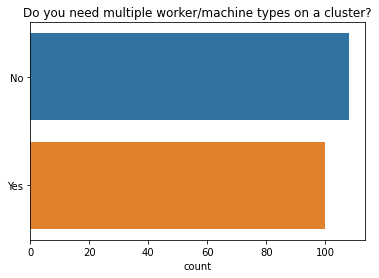
如果您使用集群,是否需要在同一集群中使用多种工作者类型?
在使用计算集群的人中,不到一半的人需要在同一集群中使用多种工作者类型。例如,这可能包括混合使用带 GPU 和不带 GPU 的工作者,混合使用内存分配低或高的工作者等。
[15]:
q = "If you use a cluster, do you have a need for multiple worker / machine types (e.g. GPU / no GPU, low / high memory) in the same cluster?"  # New question in 2021
ax = sns.countplot(y=q, data=df2021[q].dropna().str.split(";").explode().to_frame());
ax.set(ylabel="", title="Do you need multiple worker/machine types on a cluster?");
数据集
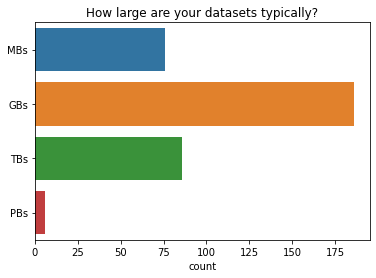
您通常的数据集有多大?
Dask 用户最常处理千兆字节大小的数据集。极少用户处理拍字节大小的数据集。
[16]:
q = "How large are your datasets typically?"  # New question in 2021
ax = sns.countplot(y=q, data=df2021[q].dropna().str.split(", ").explode().to_frame());
ax.set(ylabel="", title=q);
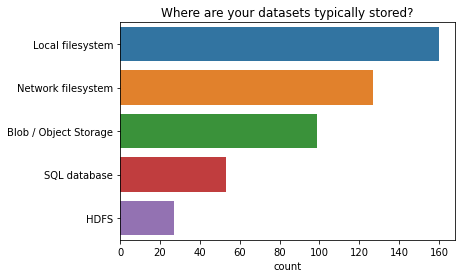
您的数据集通常存储在哪里?
大多数人将数据存储在本地文件系统上。
[17]:
q = "Where are your datasets typically stored?"  # New question in 2021
data = df2021[q].dropna().str.split(", ").explode().to_frame()
order = data.value_counts()[data.value_counts() > 1].keys().get_level_values(0)
ax = sns.countplot(y=q, data=data, order=order);
ax.set(ylabel="", title=q);
您通常使用哪些文件格式?
两种最常见的文件格式(csv 和 parquet)在 Dask Dataframe 用户中很受欢迎。JSON 文件格式也与 Dask 一起非常常用。第四和第五常用的文件类型(HDF5 和 zarr)在 Dask Array 用户中很受欢迎。这与我们所知的 Dask Dataframe API 最受欢迎,Dask Arrays 紧随其后相符。
[18]:
q = "What file formats do you typically work with?"  # New question in 2021
data = df2021[q].dropna().str.split(", ").explode().to_frame()
order = data.value_counts()[data.value_counts() > 1].keys().get_level_values(0)
ax = sns.countplot(y=q, data=data, order=order);
ax.set(ylabel="", title=q);
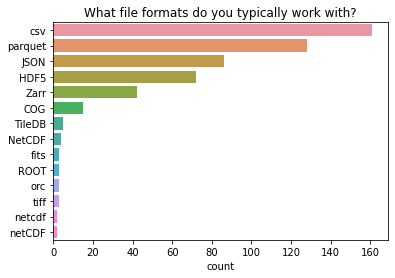
这个调查问题有一个长尾效应:报告了各种各样的专用文件格式,大多数只被一两个回复调查的人使用。
许多这些专用文件格式存储图像数据,特定于特定领域(天文学、地球科学、显微镜学等)。
[19]:
list(data.value_counts()[data.value_counts() == 1].keys().get_level_values(0))
[19]:
['proprietary measurement format',
 'netCDF3',
 'czi',
 'specifically NetCDF4',
 'grib2',
 'in-house npy-like array format',
 'jpeg2000',
 'netCDF4 (based on HDF5)',
 'proprietary microscopy file types. Often I convert to Zarr with a loss of metadata.',
 'sas7bdat',
 'npy',
 'npy and pickle',
 'root with uproot',
 'root',
 'regular GeoTiff',
 '.npy',
 'Text',
 'VCF BAM CRAM',
 'UM',
 'CASA measurement sets',
 'Casa Tables (Radio Astronomy specific)',
 'Custom binary',
 'FITS',
 'FITS (astronomical images)',
 'FITS and a custom semi-relational table specification that I want to kill and replace with something better',
 'Feather (Arrow)',
 'GPKG',
 'GeoTIFF',
 'NetCDF4',
 'Netcdf',
 'Netcdf4',
 'PP',
 'SQL',
 'SQL query to remote DB',
 'SQL to Dataframe',
 'Seismic data (miniSEED)',
 'TFRecords',
 'TIFF',
 'Testing with all file formats. Just want it as a replacement for spark. ',
 '.raw image files',
 'ugh']

XKCD 漫画“标准” https://xkcd.com/927/
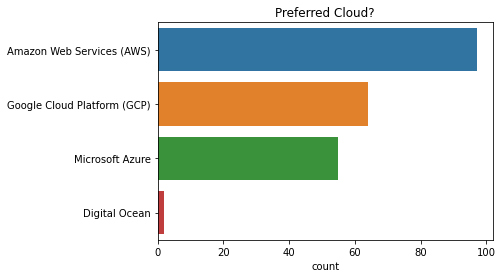
首选云?
最受欢迎的云解决方案是 Amazon Web Services (AWS),其次是 Google Cloud Platform (GCP) 和 Microsoft Azure。
[20]:
q = "Preferred Cloud?"
order = [
    "Amazon Web Services (AWS)",
    "Google Cloud Platform (GCP)",
    "Microsoft Azure",
    "Digital Ocean",
]
ax = sns.countplot(y=q, data=df2021[q].dropna().str.split(", ").explode().to_frame(), order=order);
ax.set(ylabel="", title=q);
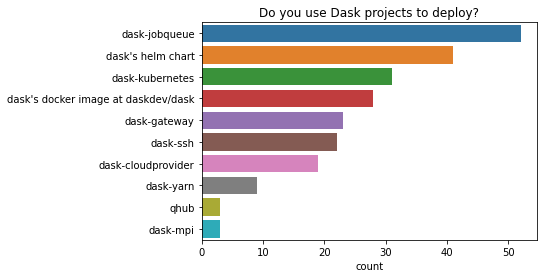
您使用 Dask 项目进行部署吗?
在使用 dask 项目进行部署的人中,dask-jobqueue 和 dask helm chart 是两个最受欢迎的选项。人们用于部署的项目种类繁多。
[21]:
q = "Do you use Dask projects to deploy?"
order = [
    "dask-jobqueue",
    "dask's helm chart",
    "dask-kubernetes",
    "dask's docker image at daskdev/dask",
    "dask-gateway",
    "dask-ssh",
    "dask-cloudprovider",
    "dask-yarn",
    "qhub",
    "dask-mpi",
]
ax = sns.countplot(y=q, data=df2021[q].dropna().str.lower().str.split(", ").explode().to_frame(), order=order);
ax.set(ylabel="", title=q);
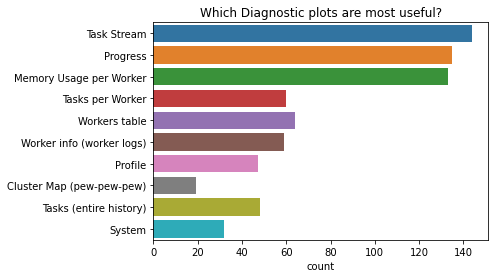
诊断
我们之前看到,大多数人喜欢使用网络浏览器查看 Dask 仪表板。
在仪表板中,人们表示最有用的诊断图是
任务流图
进度图,以及
每个工作者的内存使用图
[22]:
q = "Which Diagnostic plots are most useful?"  # New question in 2021
ax = sns.countplot(y=q, data=df2021[q].dropna().str.split(', ').explode().to_frame());
ax.set(ylabel="", title=q);
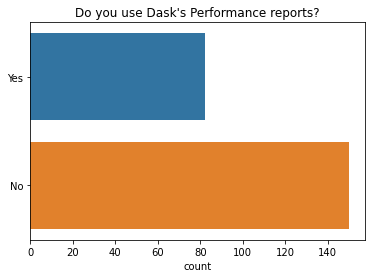
我们还在 2021 年问了一些关于诊断的新问题。
我们发现大多数人(65%)不使用 Dask 性能报告,这是一种将诊断仪表板保存为静态 HTML 图以供以后查看的方法。
[23]:
q = "Do you use Dask's Performance reports?"  # New question in 2021
ax = sns.countplot(y=q, data=df2021[q].explode().to_frame(), order=["Yes", "No"]);
ax.set(ylabel="", title=q);
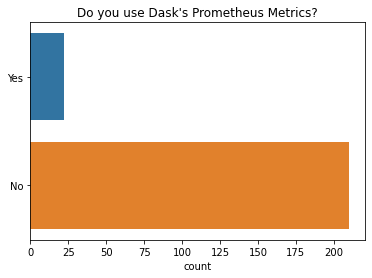
很少有人使用 Dask 的 Prometheus 指标。如果您有兴趣了解更多关于如何使用此功能的信息,Jacob Tomlinson 有一篇关于 使用 Prometheus + Grafana 监控 Dask + RAPIDS 的优秀文章。
[24]:
q = "Do you use Dask's Prometheus Metrics?"  # New question in 2021
ax = sns.countplot(y=q, data=df2021[q].explode().to_frame(), order=["Yes", "No"]);
ax.set(ylabel="", title=q);
稳定性
我们问了许多关于 Dask 稳定性的问题,其中许多是 2021 年的新问题。
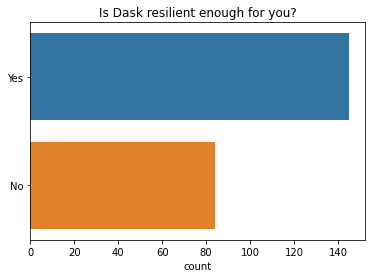
大多数人表示 Dask 对他们来说足够有弹性(例如:计算能完成)。然而,这是我们可以改进的领域,因为有 36% 的人不满意。这是 2021 年的一个新问题,所以我们无法判断人们对 Dask 弹性的看法随着时间推移有何变化。
[25]:
q = "Is Dask resilient enough for you? (e.g. computations complete)."  # new question in 2021
ax = sns.countplot(y=q, data=df2021[q].dropna().explode().to_frame(), order=["Yes", "No"]);
ax.set(ylabel="", title="Is Dask resilient enough for you?");
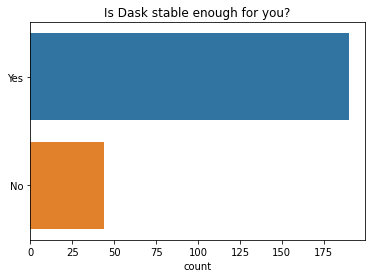
大多数人表示 Dask 总体上对他们来说足够稳定(例如:在不同版本发布之间)。这与往年的调查结果相似。
[26]:
q = "Is Dask stable enough for you?"
ax = sns.countplot(y=q, data=df2021[q].dropna().explode().to_frame(), order=["Yes", "No"]);
ax.set(ylabel="", title=q);
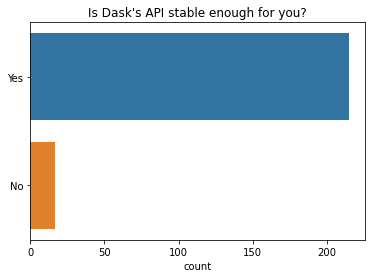
人们还表示 Dask 的 API 对他们来说也足够稳定。
[27]:
q = "Is Dask's API stable enough for you?"
ax = sns.countplot(y=q, data=df2021[q].dropna().explode().to_frame(), order=["Yes", "No"]);
ax.set(ylabel="", title=q);
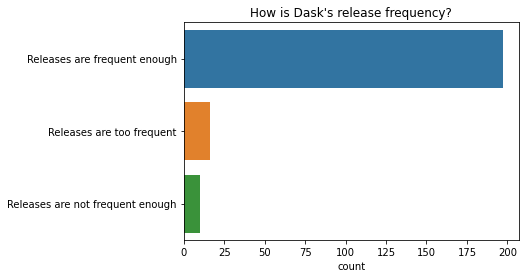
绝大多数人对当前的发布频率(大约每两周一次)表示满意。
[28]:
q = "How is Dask's release frequency?"  # New question in 2021
ax = sns.countplot(y=q, data=df2021[q].dropna().explode().to_frame());
ax.set(ylabel="", title=q);
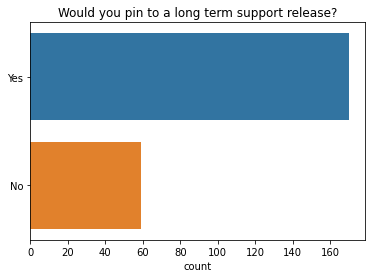
大多数人表示,如果 Dask 提供长期支持版本,他们会将代码固定在该版本上。
[29]:
q = "If Dask had Long-term support (LTS) releases, would you pin your code to use them?"  # New question in 2021
ax = sns.countplot(y=q, data=df2021[q].dropna().explode().to_frame(), order=["Yes", "No"]);
ax.set(ylabel="", title="Would you pin to a long term support release?");
用户满意度、支持和文档
我们在 2021 年的调查中问了许多关于用户满意度的新问题。
Dask 的易用性如何?
大多数人表示 Dask 的易用性适中,与往年调查结果相同。
[30]:
q = "On a scale of 1 - 5 (1 being hardest, 5 being easiest) how easy is Dask to use?"
ax = sns.countplot(y=q, data=df2021[q].dropna().explode().to_frame());
ax.set(ylabel="1 = Difficult, 5 = Easy", title="How easy is Dask to use?");

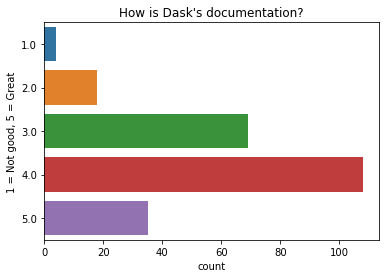
Dask 的文档如何?
大多数人认为 Dask 的文档非常好。
[31]:
q = "How is Dask's documentation?"  # New question in 2021
ax = sns.countplot(y=q, data=df2021[q].dropna().explode().to_frame());
ax.set(ylabel="1 = Not good, 5 = Great", title=q);
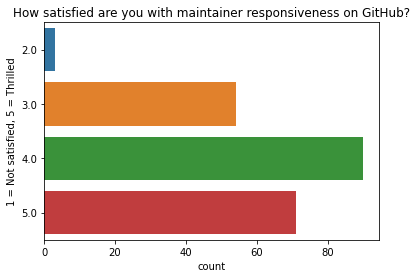
您对 GitHub 上维护者的响应速度有多满意?
几乎所有回复者都对 Dask 在 GitHub 上的维护者响应速度表示肯定。
[32]:
q = "How satisfied are you with maintainer responsiveness on GitHub?"  # New question in 2021
ax = sns.countplot(y=q, data=df2021[q].dropna().explode().to_frame());
ax.set(ylabel="1 = Not satisfied, 5 = Thrilled", title=q);
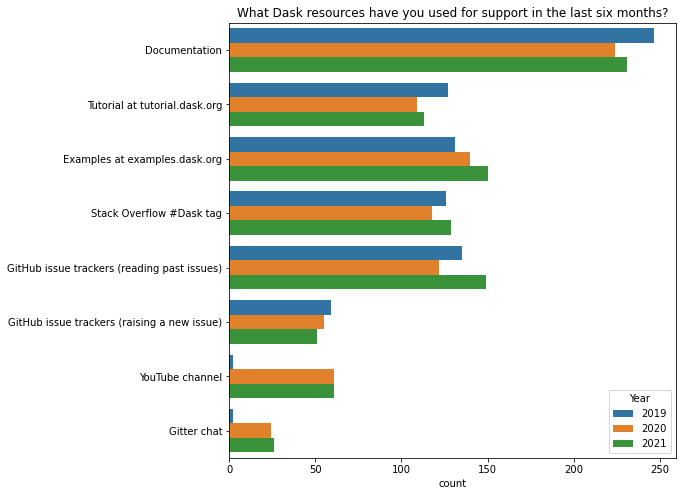
过去六个月您使用过哪些 Dask 资源来获取支持?
dask.org 上的文档是大多数用户寻求帮助的首选之地。
2021 年对这个问题的回答分布与往年非常相似,唯一的例外是 2019 年似乎没有人知道 Dask YouTube 频道或 Gitter 聊天室存在。
[33]:
q = 'What Dask resources have you used for support in the last six months?'

resource_map = {
    "Tutorial": "Tutorial at tutorial.dask.org",
    "YouTube": "YouTube channel",
    "gitter": "Gitter chat"
}

df[q] = df[q].str.replace(';',', ')  # Make separator values consistent
d = df[q].str.split(', ').explode().replace(resource_map)
top = d.value_counts()[:8].index
d = d[d.isin(top)]

fig, ax = plt.subplots(figsize=(8, 8))
ax = sns.countplot(y=q, hue="Year", data=d.reset_index(), ax=ax);
ax.set(ylabel="", title=q);
改进建议
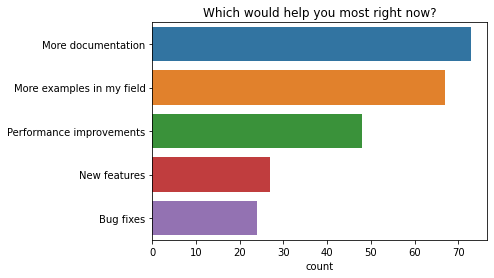
目前什么对您帮助最大?
人们表示目前帮助最大的两个首要任务都与文档有关。人们想要更多的文档以及更多其领域内的示例。性能改进也被普遍提及为目前帮助最大的事情。
[34]:
q = "Which would help you most right now?"
order = [
    "More documentation",
    "More examples in my field",
    "Performance improvements",
    "New features",
    "Bug fixes",
]
ax = sns.countplot(y=q, data=df2021[q].explode().to_frame(), order=order)
ax.set(ylabel="", title=q);
Dask 如何改进?
我们还提供了机会让人们自由文本回复“Dask 如何改进?”这个问题。
Matt 之前写了一篇关于 早期轶事 的博客文章,更详细地深入探讨了这个问题的回复。
他发现了这些反复出现的主题
中级文档
文档组织
功能性
高级优化
运行时稳定性和高级故障排除
由于更多的文档和示例是两个最常被要求的改进,我在此总结一下该领域的一些进展
关于更多中级文档,Matt 说:> 高级用户有很多关于性能和调试的很好的潜在材料,出版这些材料可能会很有趣。
Matt 指出 Dask 有出色的参考文档,但缺乏很多好的叙述性文档。为了解决这个问题,Julia Signell 目前正在研究如何改进 Dask 文档的组织(如果您想关注该讨论,可以订阅此议题帖)
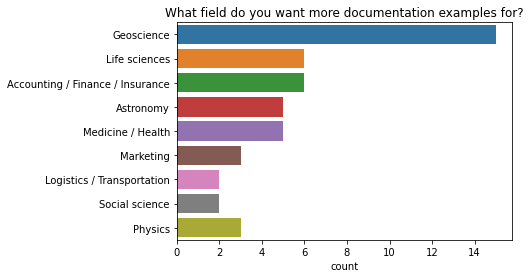
Matt 评论说,当有这么多不同的用户叙事(即 Dask 被来自许多不同行业的人使用)时,很难有好的叙述性文档。今年,我们在调查中增加了一个新问题,询问人们工作的行业。我们之所以增加这个问题,是因为“更多我的领域内的示例”在过去三年一直是前两个请求之一。现在我们可以利用这些信息,更好地将叙述性文档针对最需要的领域(地球科学、生命科学和金融)。
[35]:
q = 'What industry do you work in?'
data = df2021[df2021["Which would help you most right now?"] == "More examples in my field"]
order = data[q].value_counts()[data[q].value_counts() > 1].keys()
ax = sns.countplot(y=q, data=data[q].dropna().str.split(', ').explode().to_frame(), order=order);
ax.set(ylabel="", title="What field do you want more documentation examples for?");
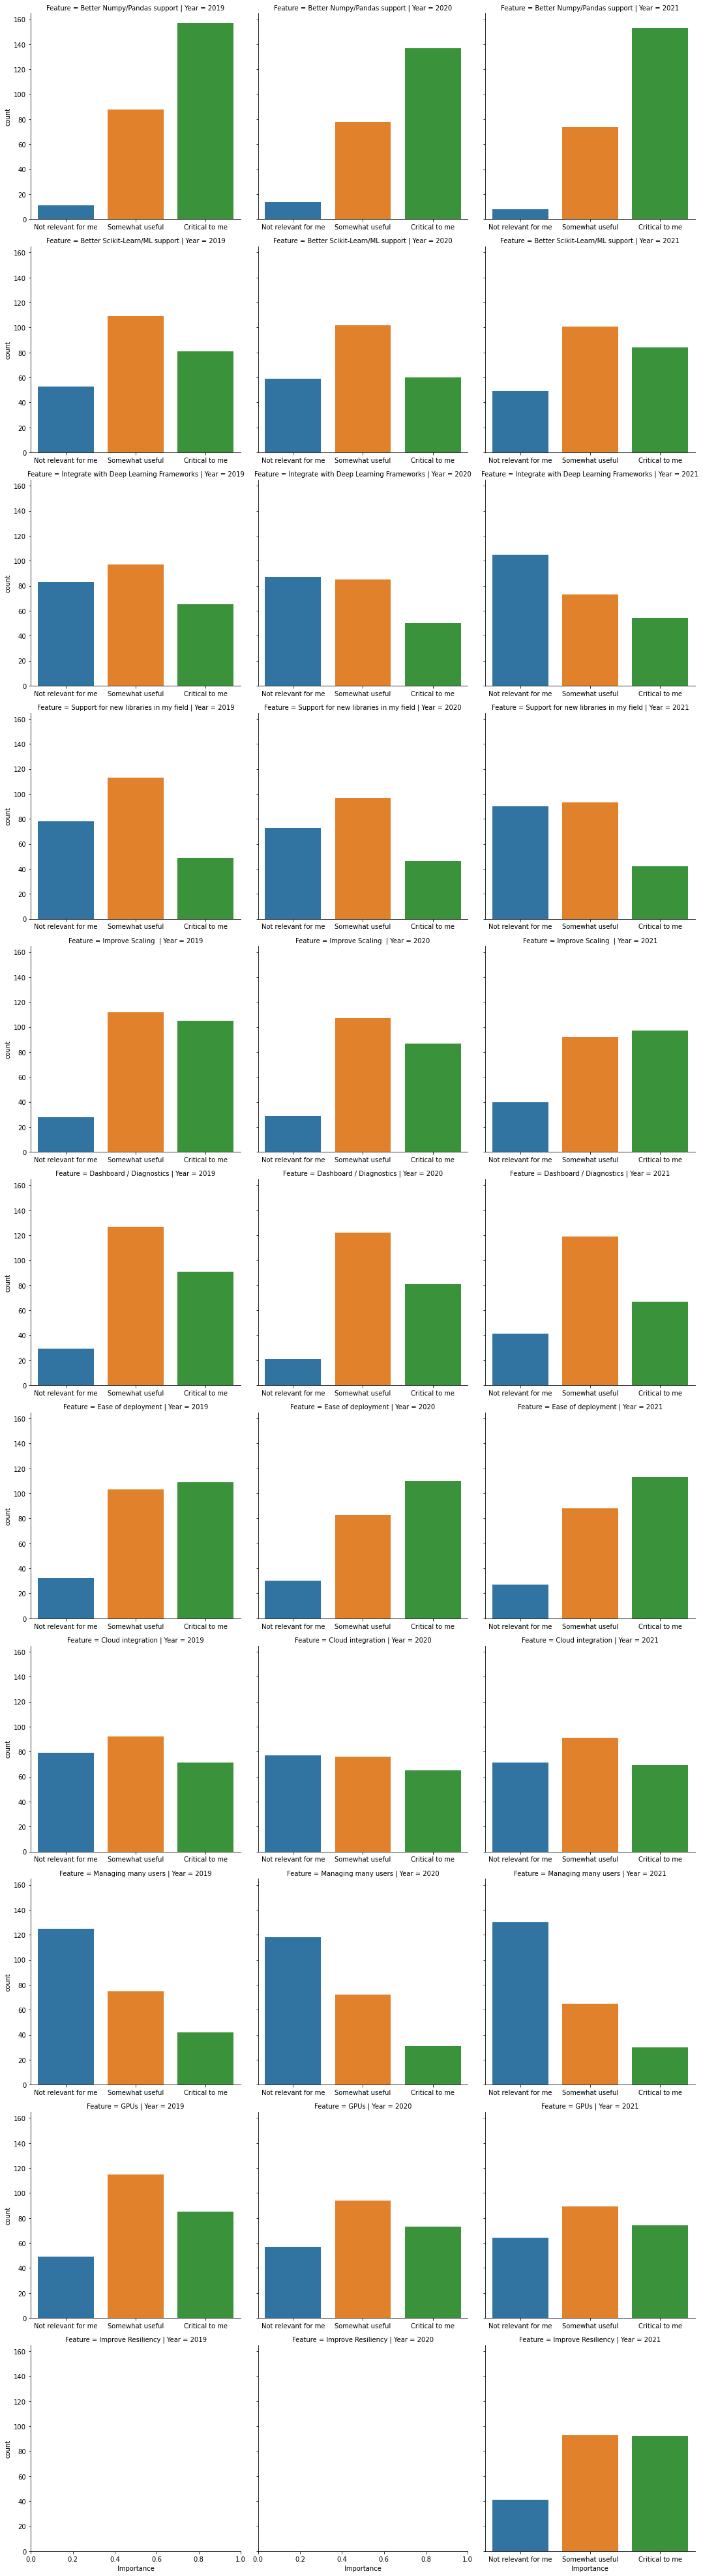
您最关心哪些常见的特性请求?
对 numpy 和 pandas 的良好支持对大多数用户至关重要。用户也看重
改进的扩展性
易于部署
Dask 的弹性
更好的 scikit-learn 和机器学习支持
大多数特性请求与往年的调查结果相似,尽管表示更好的 scikit-learn/ML 支持对他们至关重要的人数有所增加。我们还在 2021 年增加了一个关于 Dask 弹性的新问题。
在下图中,您可以看到人们在过去三年中如何评价每个特性请求的重要性。
[36]:
common = (df[df.columns[df.columns.str.startswith("What common feature")]]
          .rename(columns=lambda x: x.lstrip("What common feature requests do you care about most?[").rstrip(r"]")))
a = common.loc[2019].apply(pd.value_counts).T.stack().reset_index().rename(columns={'level_0': 'Question', 'level_1': "Importance", 0: "count"}).assign(Year=2019)
b = common.loc[2020].apply(pd.value_counts).T.stack().reset_index().rename(columns={'level_0': 'Question', 'level_1': "Importance", 0: "count"}).assign(Year=2020)
c = common.loc[2021].apply(pd.value_counts).T.stack().reset_index().rename(columns={'level_0': 'Question', 'level_1': "Importance", 0: "count"}).assign(Year=2021)

counts = pd.concat([a, b, c], ignore_index=True)

d = common.stack().reset_index().rename(columns={"level_2": "Feature", 0: "Importance"})
order = ["Not relevant for me", "Somewhat useful", 'Critical to me']
sns.catplot(x='Importance', row="Feature", kind="count", col="Year", data=d, sharex=False, order=order);